
Think business before wireframes

When kicking off a new digital product design, it’s tempting to dive straight into wireframes and feature brainstorming. The most valuable design work, however, starts with clarity - not creativity.
Yes, we love brainstorming features, sketching flows, and debating UI details. But if we jump into wireframes without knowing what business outcomes we’re driving, we’re designing in the dark.
Understanding what success means in business terms lays foundations to defining UX metrics that further guide design decisions and ultimately help to achieve the defined business objectives.
No analytics? Start with intention
At the beginning of a project, we don’t have analytics yet, but what we can do is get clear on why we build what we build and what we’ll want to measure once the product starts gaining traction.
This approach helps teams think business, while staying user-centric and turning design into a focused, collaborative effort.
While in reality there are multiple objectives, it helps to align on an overarching goal such as: acquire leads, drive sign-ups, improve product activation or increase conversion rates.
Let us work through an example.
Let’s say we’re building a new B2B SaaS productivity tool. Our first job is to answer the question:
What business outcome does this product need to support and what user behaviours will get us there?
Let us work towards a conversion goal:
Increase trial-to-paid conversion within 14 days.
This is our north star. But it’s also a lagging metric, so we need to figure out it backwards: what user actions leads to that result?
Identify key user behaviours
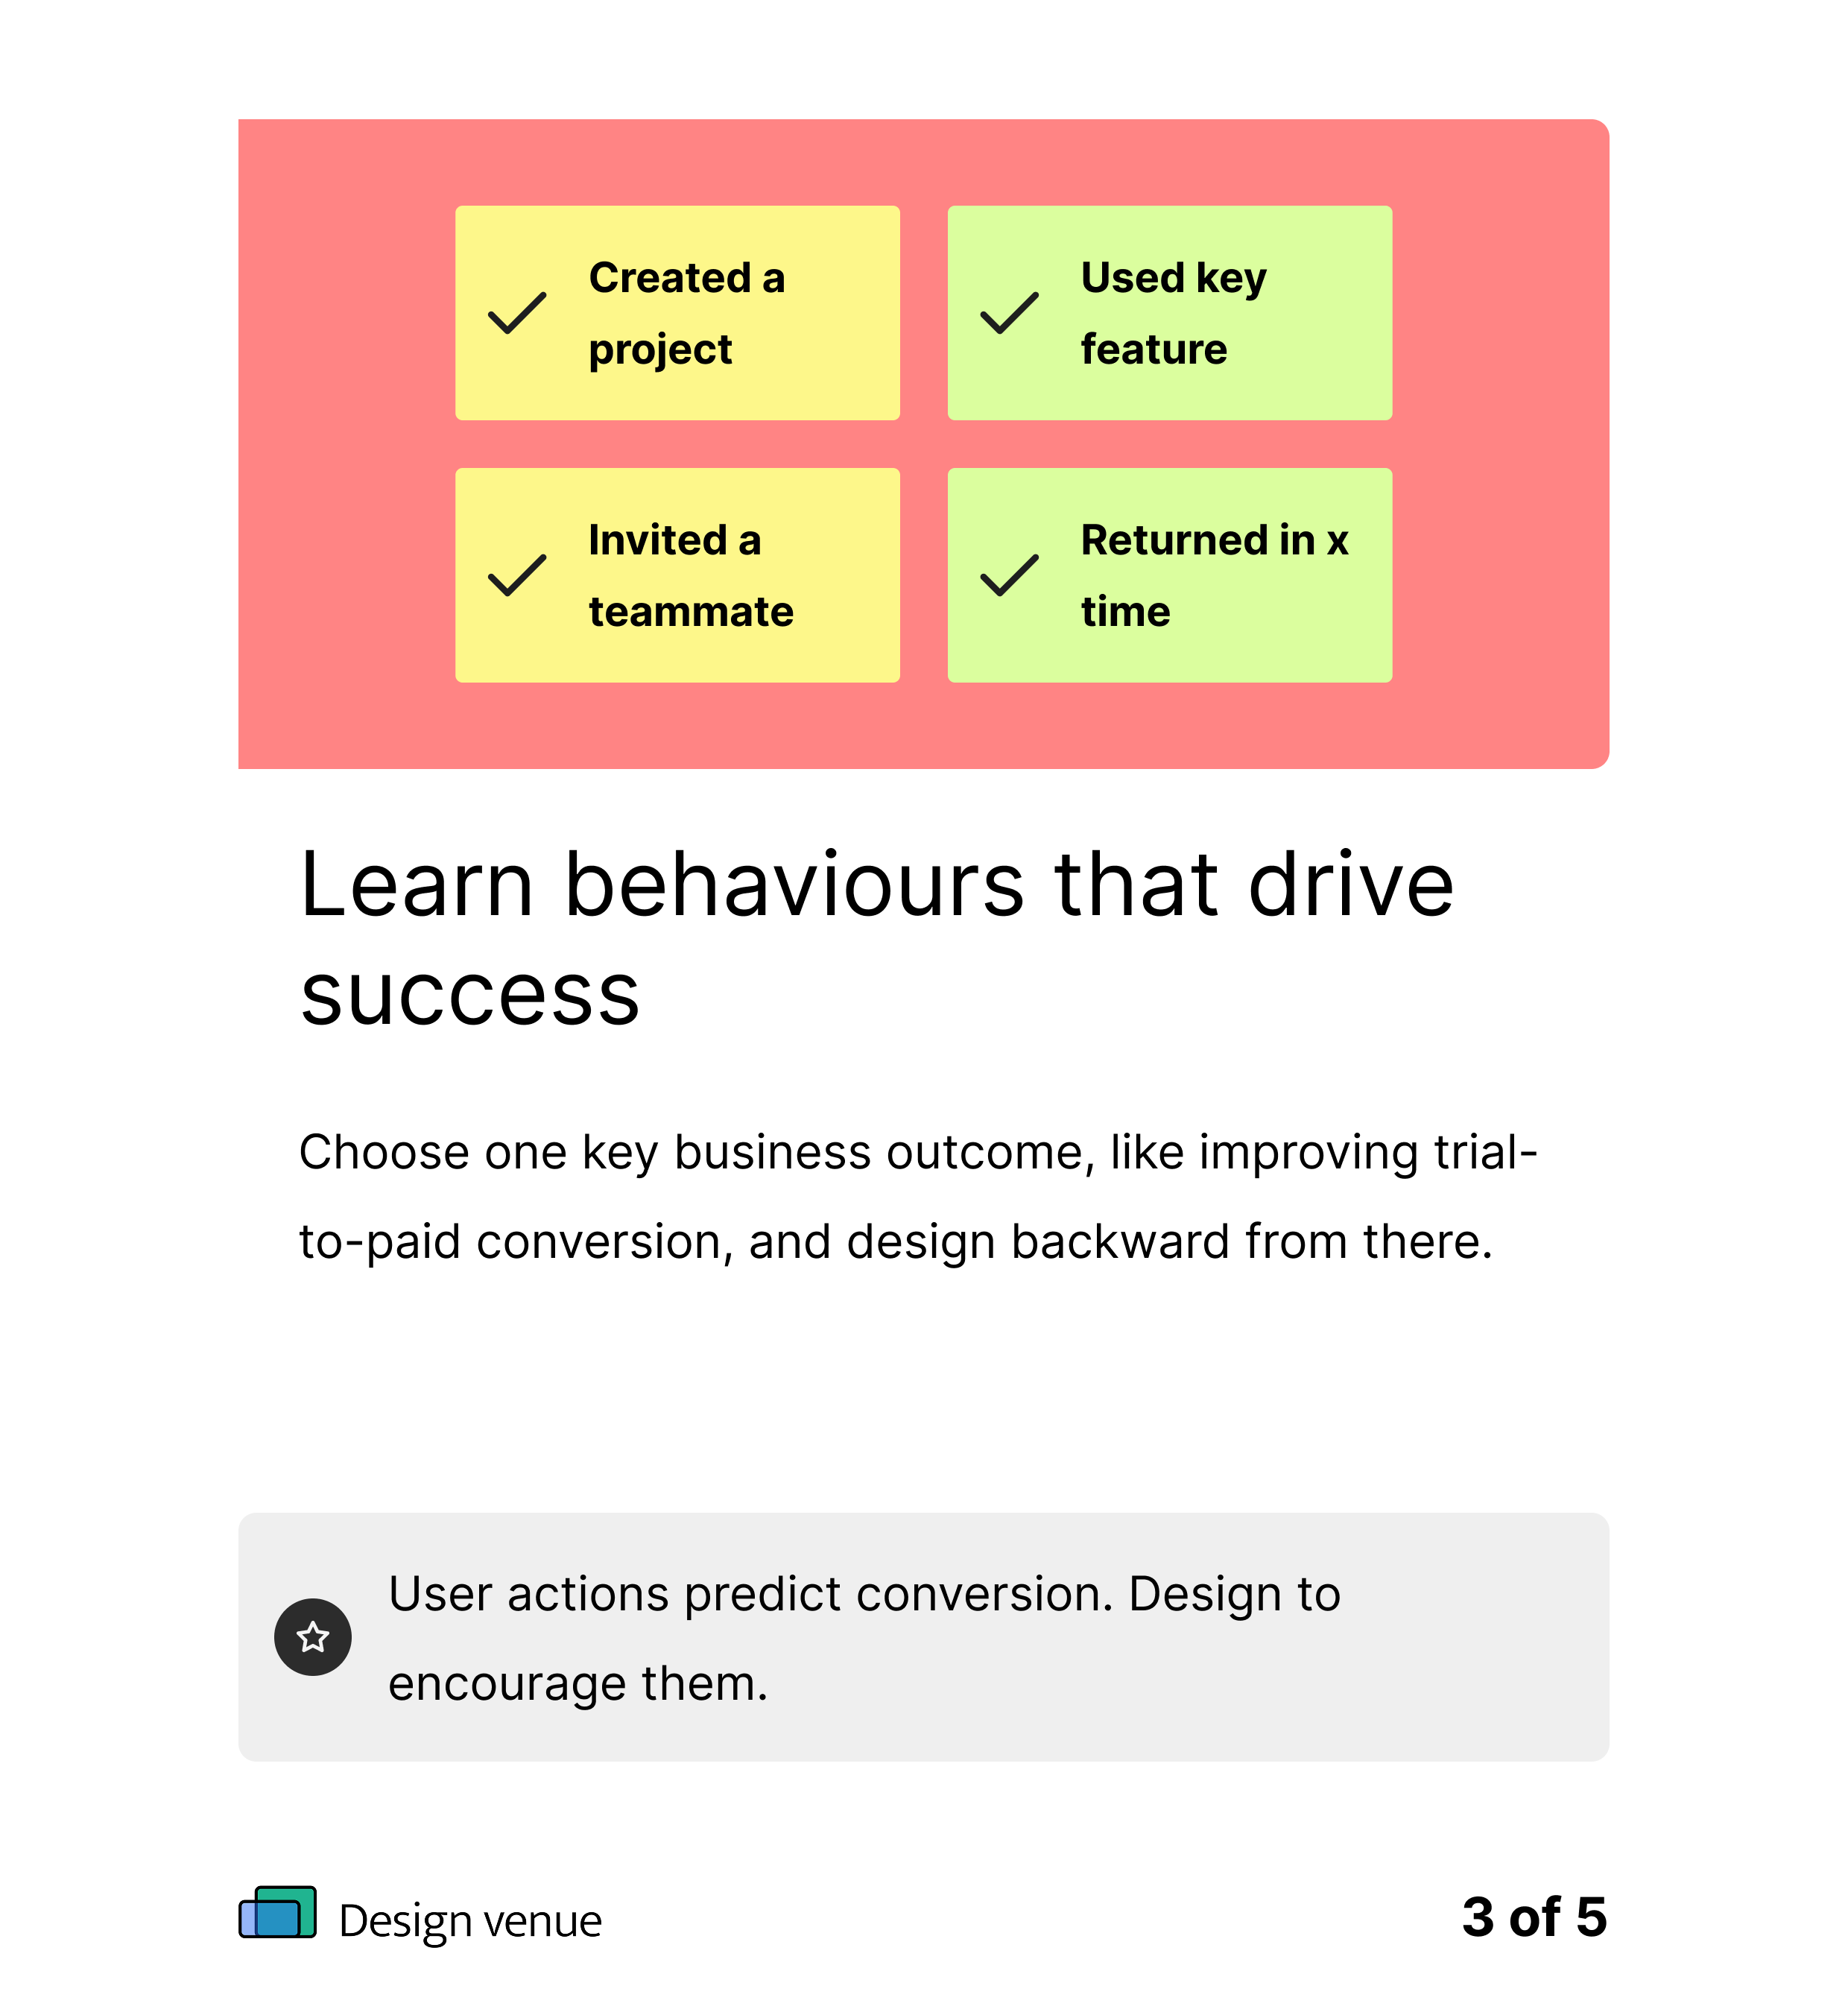
Using research and our intuition we might come up with a few signalling behaviours
• Users who create a project are more likely to convert
• Users who invite teammates tend to stick around
• Users who try a key feature often become active users
• Users who return within 3 days are more likely to upgrade
Set UX metrics measuring these behaviours
These behaviours can be directly turned into measurable objectives that designers and developers can work towards to, helping to reach the business goal.
User action
Creates a project
Invites others
Uses key feature (e.g., task automation)
Returns to the platform
UX metric
Time to first project creation
% of users who invite a teammate
Feature adoption rate
% of users returning 3 days
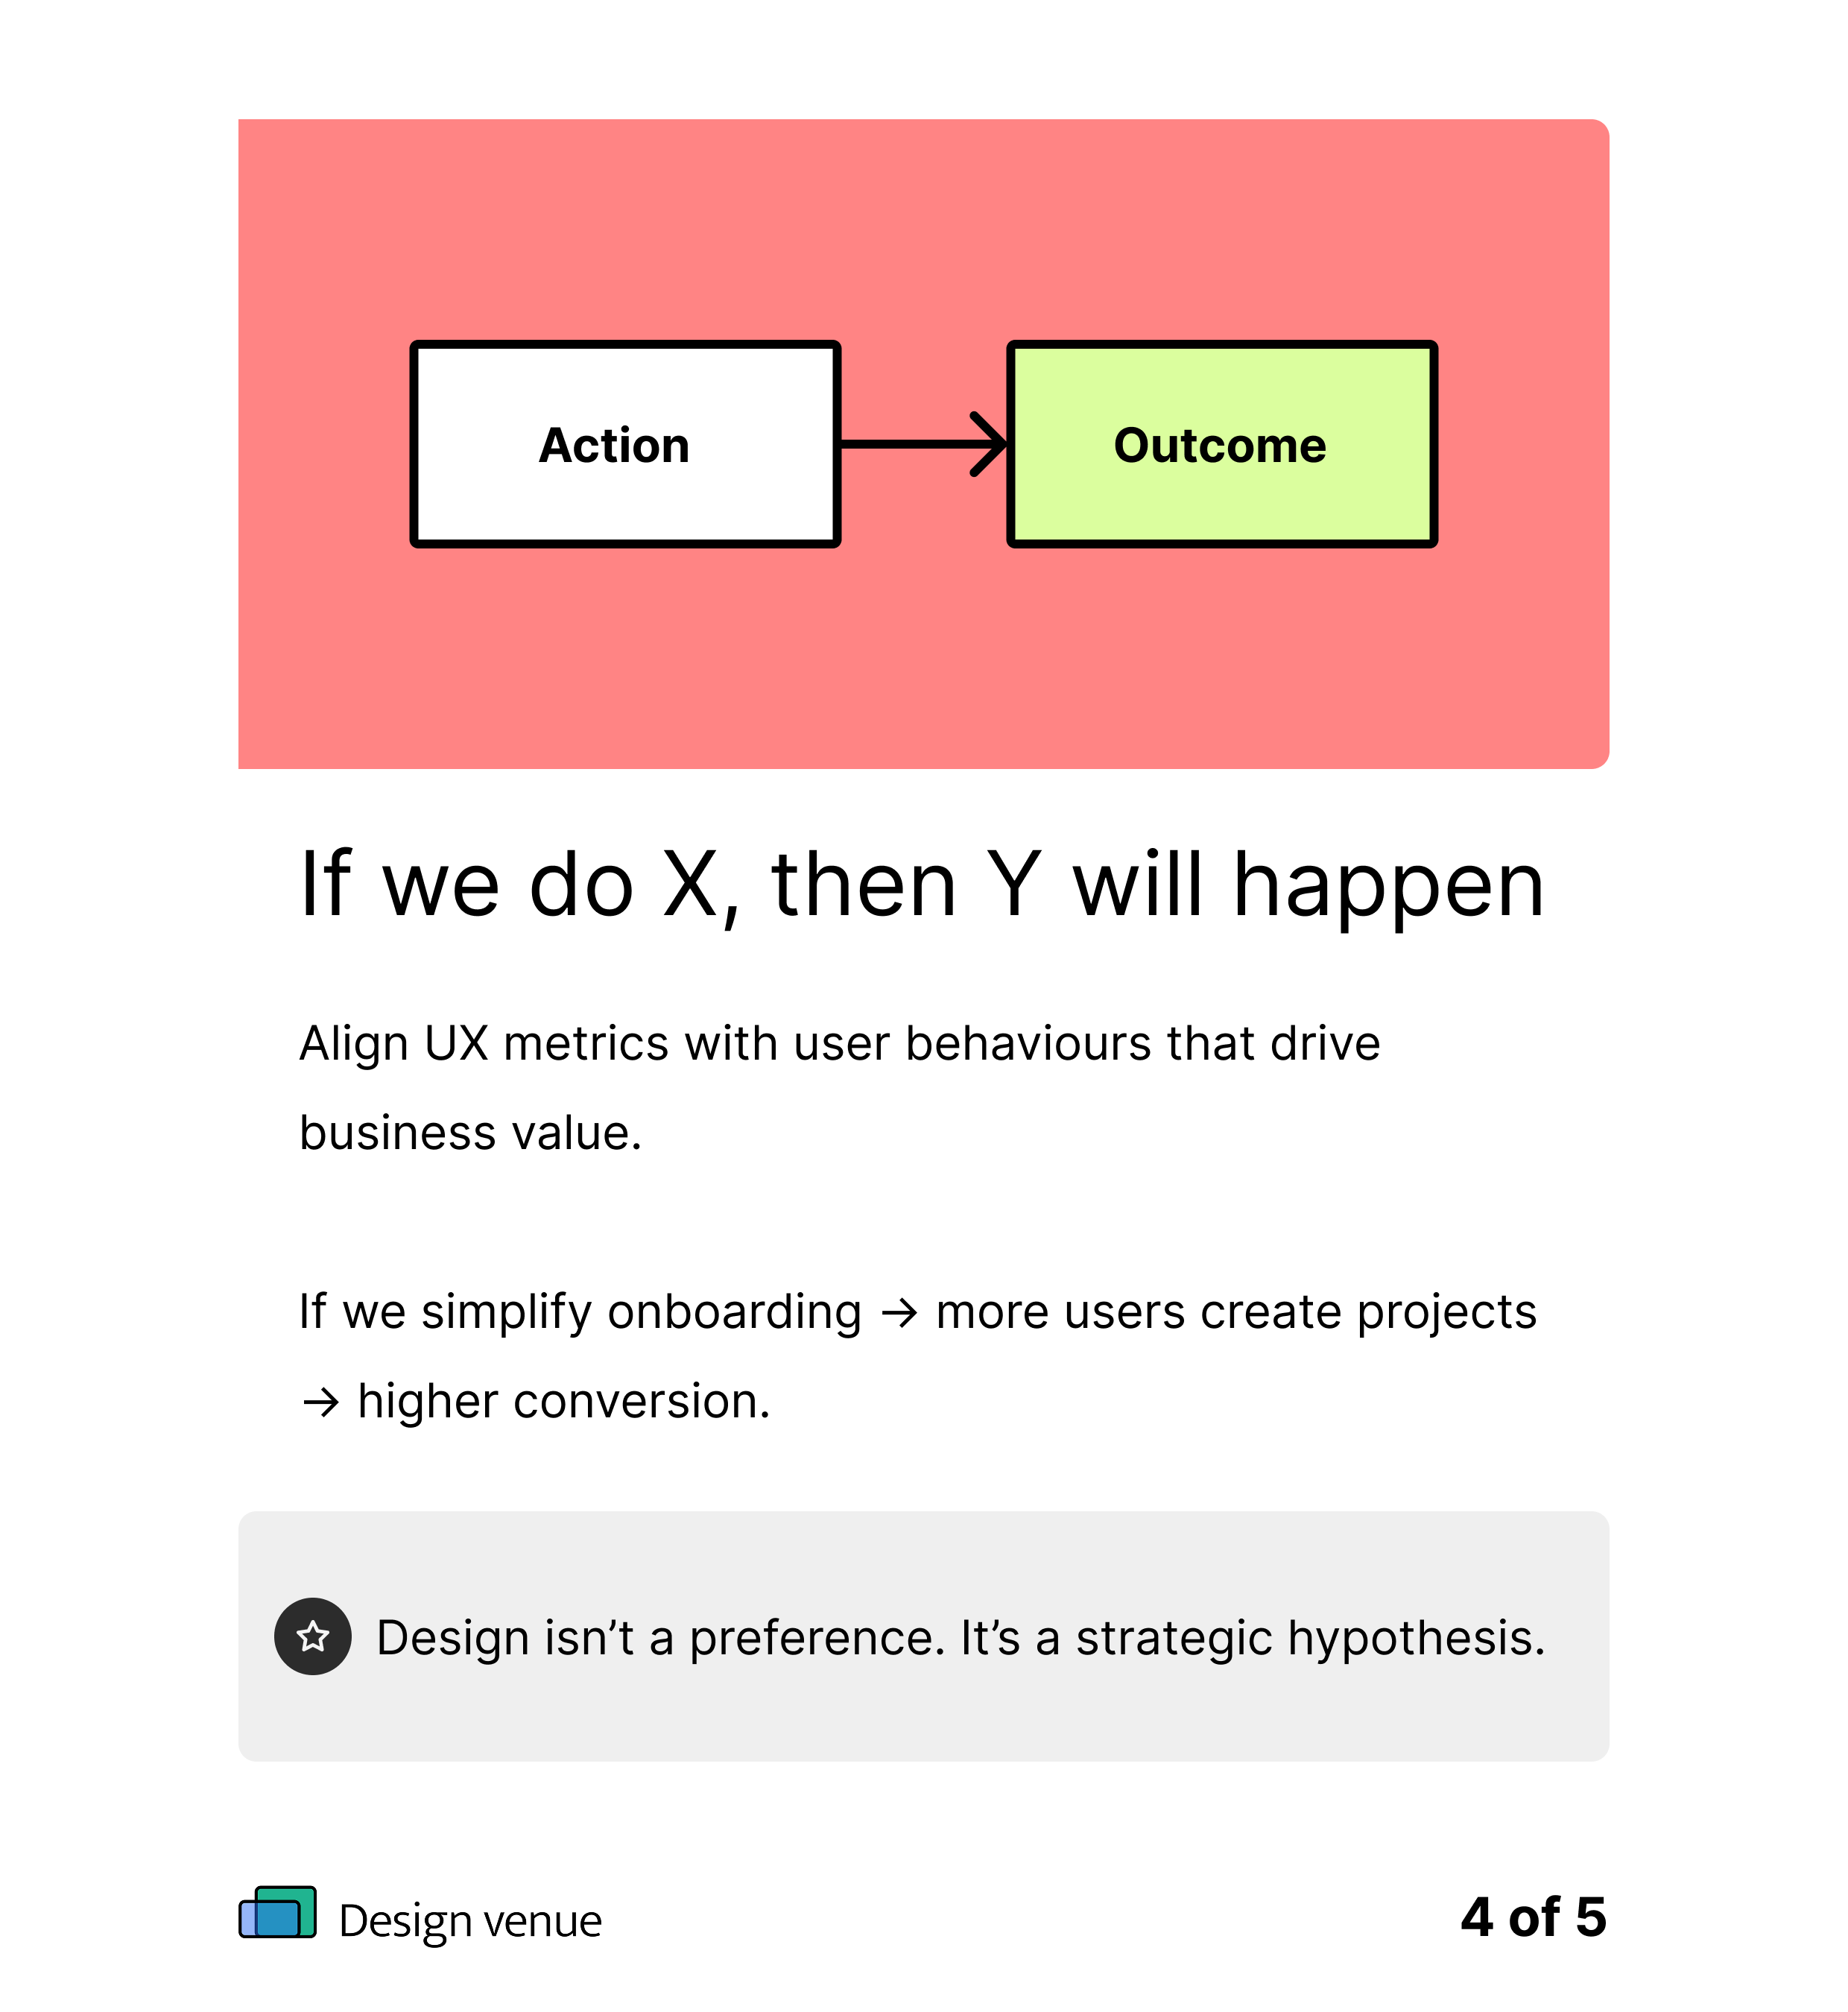
This gives designers a way more clarity and focus. Instead of guessing, design decisions are shaped around a clear hypothesis:
If we simplify onboarding and highlight project creation, users will try out the features and conversion rate will rise.
This kind of thinking turns into very practical design goals, like:
Making it easier to go from sign-up to first project
Adding helpful nudges in the app
Highlighting the value of advanced features
Now we’re designing with purpose and not preference.
Track, learn, iterate
Post-launch, we can track these metrics to see how well our design decisions are performing.
Average time to first key action - are users getting to value quickly or getting stuck?
% of users completing onboarding steps - is the flow clear and engaging enough to get them through?
Feature popularity - which features users are mostly interested in and which are being ignored?
Trial to paid conversion ratio - are users seeing enough value to covert
Now we have a feedback loop: we don’t just know what happened, we know why and where to iterate to improve. It’s also what makes the whole team from product to design to engineering feel like they’re solving a puzzle together.
With the right metrics, design becomes a hypothesis you can test and measure and also demonstrate the design value to stakeholders. Design isn’t just visual anymore - it’s strategic.